
What this article is about
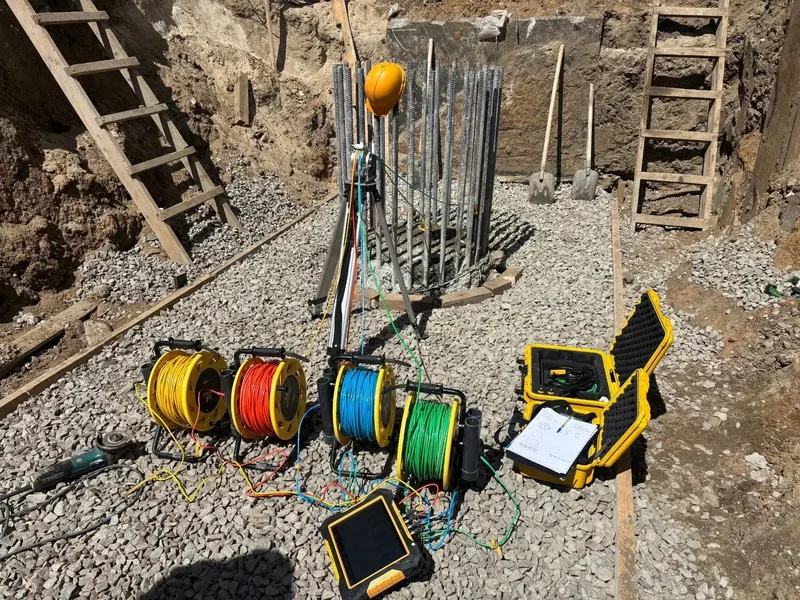
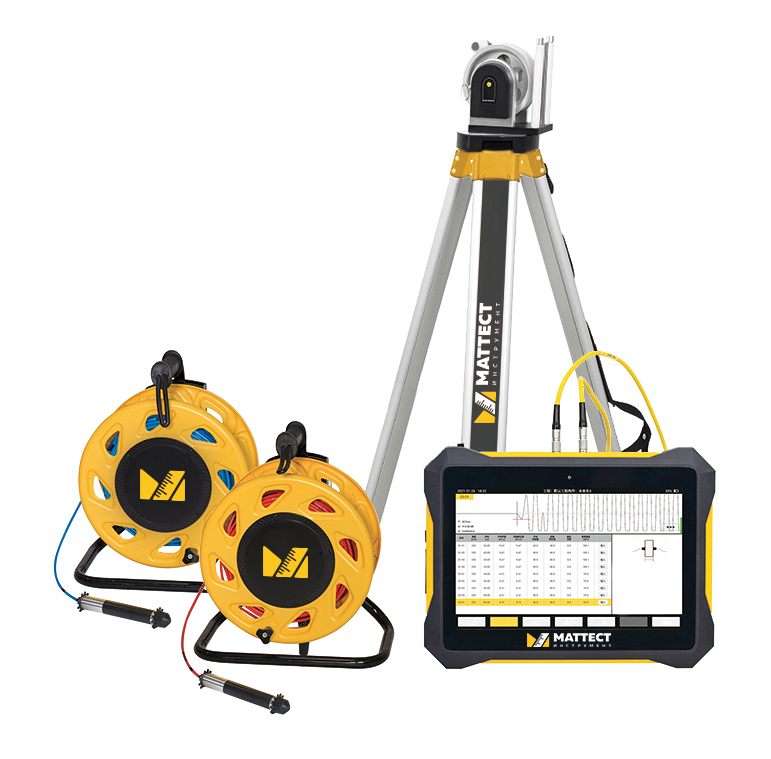
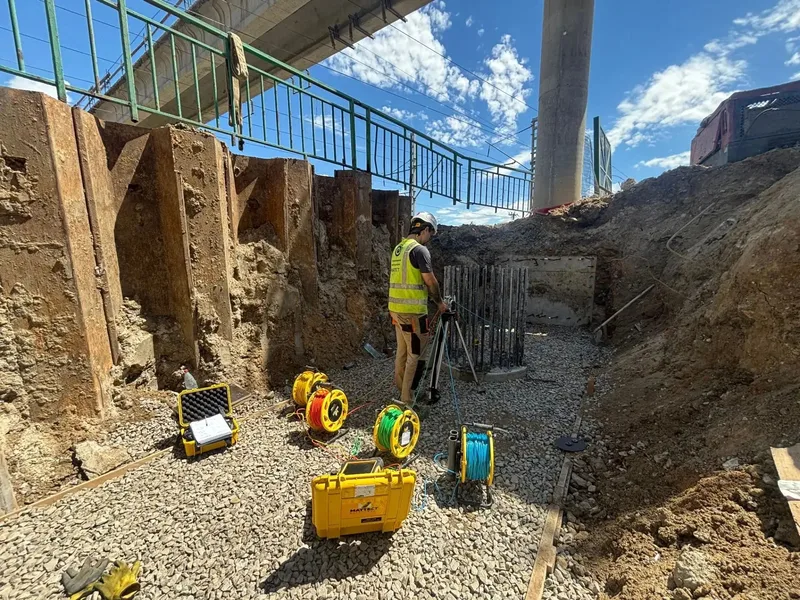
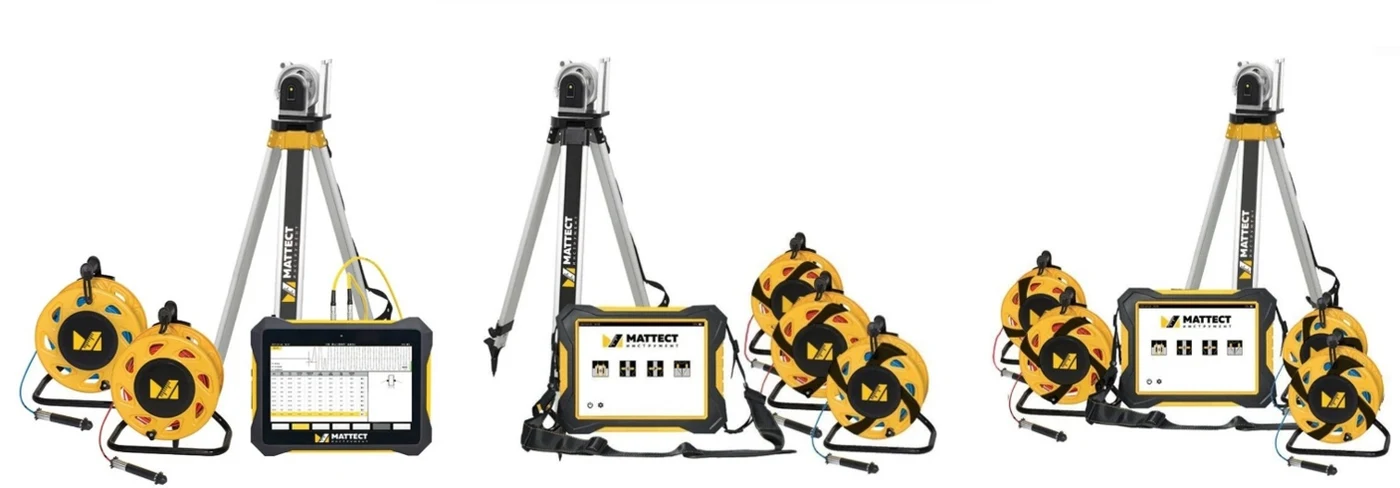
Construction testing laboratories, as well as expert centers, face the challenge of statistical processing of data from ultrasonic testing of pile concrete. MIT UZK by M-Instrument offers a solution to this problem through the use of the MIT UZK-1-2K, MIT UZK-1-3K and MIT UZK-1-4K devices (see Fig. 1) together with the MIT UZK software suite.
In our first article "Statistical processing algorithm for CSL pile testing data in MIT UZK MONOLITH" we described in detail the algorithm implemented in the MIT UZK software suite based on JGJ 106-2014 (China). Here we set out a generic alternative algorithm applicable to any ultrasonic pile testing device — both MIT UZK devices and their analogs.
Testers who do not work with the MIT UZK line face the problem of the lack of a clear and reasonably simple algorithm for statistical processing of their measurement results. This article is the answer to that request.
Alternative algorithm: measurement parameters
This algorithm for processing and evaluating the obtained results is applicable both to data obtained with MIT UZK devices and to data from other specialized ultrasonic pile testing devices.
For each acoustic line i (cross-section of profile j) the following parameters are determined and recorded:
- depth of acoustic line i (cross-section i) of the j-th measurement profile, Zi, m;
- first-arrival time ti — time for the i-th acoustic line of the j-th measurement profile, µs;
- ultrasonic wave velocity Vi — speed of sound for the i-th acoustic line of the j-th measurement profile, m/s;
- ultrasonic signal attenuation αi — for the i-th acoustic line of the j-th measurement profile.
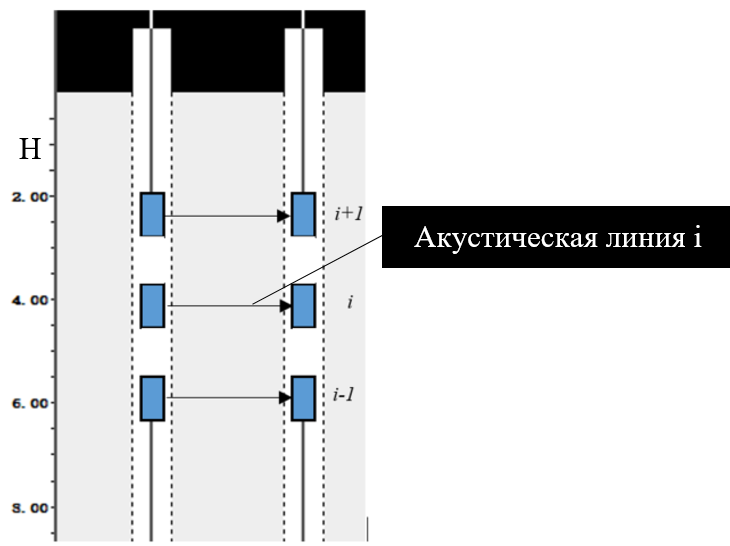
i is the acoustic-line number, assigned sequentially from bottom to top (or top to bottom) for each measurement profile j.
Step 1. First-arrival time
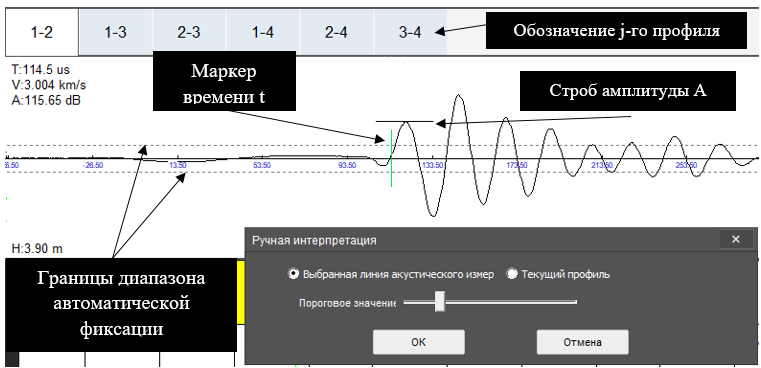
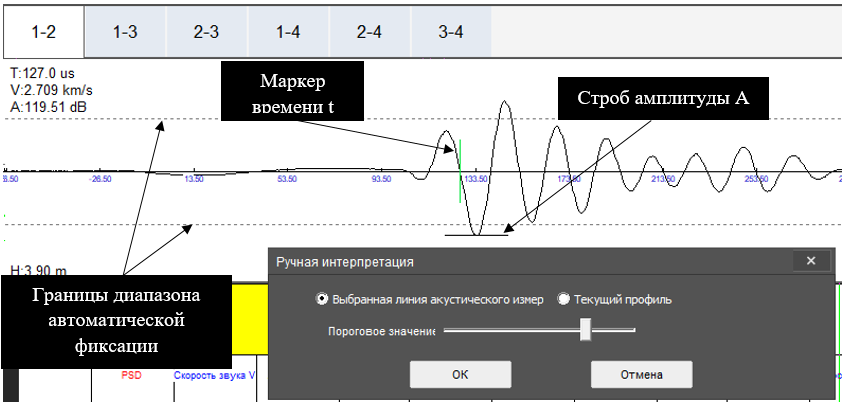
Determination of the first-arrival time ti, µs, is performed automatically using the built-in algorithms of the devices employed for ultrasonic pile testing.
The first-arrival level is usually set in the range from 20% to 80% (see Fig. 3).
Step 2. Ultrasonic signal propagation velocity
The velocity Vi, m/s, of ultrasonic signal propagation for the i-th acoustic line (i-th cross-section) of the j-th profile is computed automatically by the ultrasonic pile testing device using formula (1):
where:
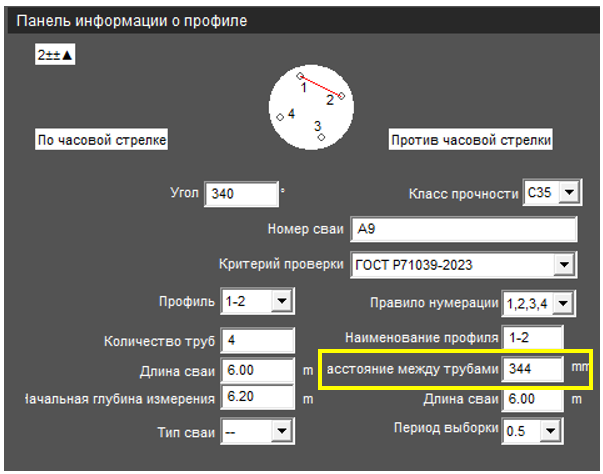
- Lj — measurement base, equal to the distance between the generatrices of the access tubes of the cross-section under study, mm (see Fig. 4);
- ti — first-arrival time for the i-th cross-section of the j-th profile, µs.
Step 3. Mean (normal) velocity — interquartile range method
To identify sharply outlying (anomalous, deviant) values in the overall array of ultrasonic wave velocities for the j-th profile, the box plot / IQR method is used.
3.1. Calculation of the first Q1 and third Q2 quartiles. The first and third quartiles correspond to the 25th (1/4) and 75th (3/4) percentiles, respectively.
3.2. Interquartile range ΔCj:
3.3. Calculation of step hj:
3.4. Inner barriers β1 and β2:
3.5. Outer barriers B1 and B2:
Values of the velocities Vi of the i-th acoustic line of the j-th measurement profile that fall beyond the outer barriers are treated as anomalies; values of Vi that fall beyond the inner barriers are treated as outliers.
Anomalies and outliers significantly affect the results of the statistical calculation, so they must be discarded from further computation. The most robust estimate of the distribution is the median Me [1].
3.6. Calculation of the median Me of the cleaned velocity array.
Odd number of velocity values Vi:
Even number of velocity values Vi:
The obtained median value corresponds to the mean (normal) velocity Vavg for the j-th measurement profile, i.e.:
If the original velocity array contains no outliers or anomalies, the median of the entire array is taken as the mean (normal) velocity of the profile.
Step 4. Deviation of velocities from the mean value
The deviations ΔVi of all velocity values Vi on the j-th measurement profile from the mean velocity Vavg are calculated in % using the formula:
where:
- Vavg — mean (normal) velocity for the j-th profile, m/s;
- Vi — ultrasonic wave propagation velocity for the i-th acoustic line, m/s.
Step 5. Signal attenuation
The MIT UZK devices provide a function for automatic determination of the signal amplitude Ai of the i-th acoustic line (see Fig. 5).
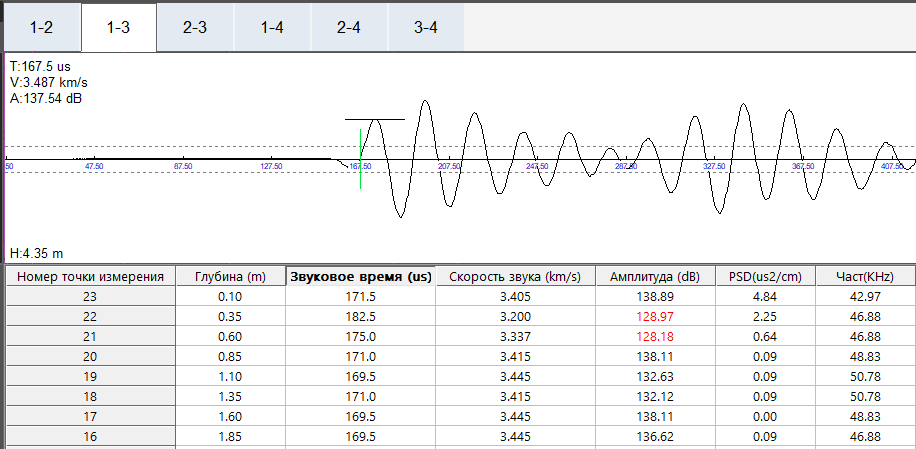
The attenuation value γij for each i-th acoustic line of the j-th profile is calculated using the formula:
where:
- Aij — first-arrival wave amplitude for the i-th acoustic line of the j-th measurement profile within the specified time window, dB;
- A0j — maximum recorded amplitude value on the j-th measurement profile, dB.
When devices other than MIT UZK are used, testers sometimes encounter difficulties in determining signal amplitude values. If such a device provides a flaw-detector mode — i.e. a graphical display mode showing the measurement results for each acoustic line (cross-section) — the amplitude of the received signal is estimated:
- by the signal amplitude as a percentage of screen height;
- by the first-arrival front Fi (V/µs), which takes into account voltage and first-arrival time. The magnitude of the first-arrival front is proportional to the amplitude of the first signal.
Attenuation can be determined by the change in signal amplitude and voltage values, in which case the attenuation for each cross-section is calculated using the formula:
where:
- Fij — first-arrival front value for the i-th cross-section, measured as a percentage of the device screen height;
- F0 — maximum first-arrival front value, equal to the maximum value recorded for the j-th profile.
If a device for pile concrete integrity testing records only the ultrasonic wave travel time and does not allow the signal energy to be determined, such a device cannot be used for full pile concrete integrity testing.
Methodology for analyzing the obtained data
The criteria for identifying ultrasonic anomalies from the deviation of the ultrasonic wave velocity Vi from the mean velocity Vavg and from the ultrasonic wave attenuation values αj for each j-th profile comply with the requirements of GOST R 71039-2023 and are shown in Fig. 6.
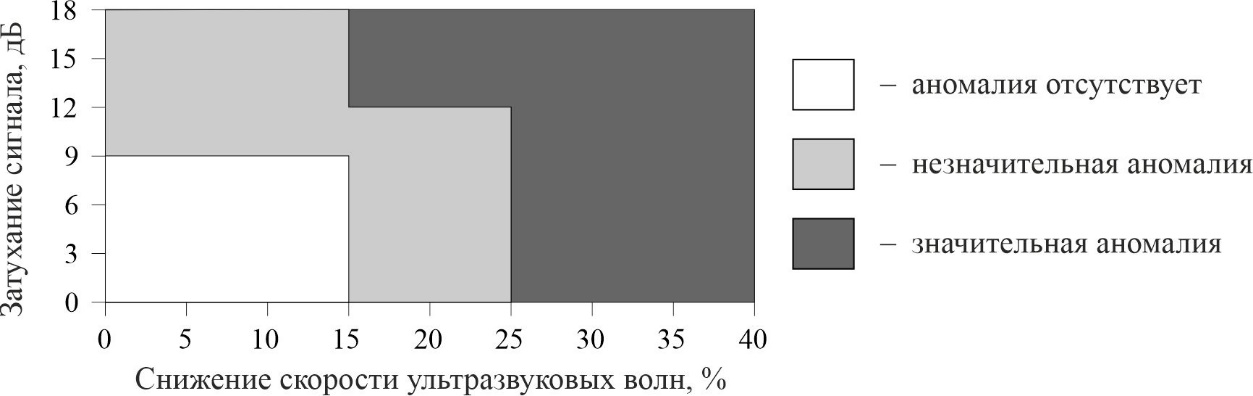
A significant anomaly is interpreted as a discontinuity in the concrete of the structure.
An anomaly is considered significant when:
- velocity reduction is greater than 25% at any attenuation values;
- velocity reduction is in the range 15% to 25% with attenuation greater than 12 dB;
- anomalies at the same depth are identified as minor on two or more longitudinal sections (profiles) of the pile.
An anomaly is considered unrelated to concrete discontinuity if the following conditions are met:
- A smooth change in ultrasonic wave velocity is observed while no increase in attenuation is present. Possible causes: access tubes are not parallel to each other; encoder malfunction; cable slippage.
- A uniform change in ultrasonic wave velocity accompanied by an increase in attenuation. Cause: non-uniform concrete strength gain rate.
If during measurements sections of the profile are identified with significant velocity reduction (more than 15% of the mean value), the scanning step is reduced to 50 mm. If necessary, such sections can be retested.
The parameters of each longitudinal profile of the pile are analyzed separately, and a conclusion on the integrity of the entire pile concrete is drawn taking into account the results from each longitudinal profile.
Note. Since the obtained results do not allow the nature of the discontinuity to be determined, the laboratory specialist may make an assumption about the causes and nature of the discontinuity taking into account external factors and pile manufacturing technology. Such an assumption is, as a rule, highly subjective and cannot be considered a final "diagnosis" for the pile.
Conclusion: compatibility with GOST R 71039-2023
The statistical processing algorithm and data analysis methodology described above generally comply with the requirements of GOST R 71039-2023 and can be recommended for use by testing laboratories regardless of the equipment employed — the MIT UZK line or its analogs.
Video overview of the device and software suite
Working with the MIT UZK-1-2K device:

More on working with the MIT UZK software suite:

Denis's first article on the JGJ 106-2014 algorithm in MIT UZK MONOLITH is available here: Statistical processing algorithm for CSL pile testing data in MIT UZK MONOLITH.
Order the MIT UZK line and software suite
MIT UZK line: 1-2K, 1-3K, 1-4K + software suite. Automatic calculation of first-arrival time, velocity and attenuation. Compatible with GOST R 71039-2023. 2/3/4-channel devices for parallel and inclined scanning.
Frequently asked questions
How does the alternative algorithm differ from the one in MIT UZK MONOLITH?
The MIT UZK MONOLITH algorithm is based on JGJ 106-2014 (China): iterative rejection of extremes + a lambda coefficient. The alternative algorithm is based on the classical interquartile range (IQR) method and is applicable to any CSL pile testing device, not only MIT.
Which devices does this algorithm work with?
Any specialized device for ultrasonic testing of pile concrete integrity, including the MIT UZK line (1-2K, 1-3K, 1-4K) and its analogs, provided the device records both the travel time and the signal energy/amplitude.
What should I do if the device does not measure signal amplitude?
Such a device cannot be used for full pile concrete integrity testing. If the device has a flaw-detector (graphical) mode, the amplitude can be estimated by the signal magnitude as a percentage of screen height or by the first-arrival front Fi (V/µs).
How is a significant anomaly defined under GOST R 71039-2023?
An anomaly is considered significant if the velocity reduction exceeds 25% at any attenuation value, or if the velocity reduction is 15–25% with attenuation greater than 12 dB. If an anomaly at the same depth appears as minor on two or more longitudinal profiles of the pile, it is also considered significant.
What should be done when a section with velocity reduction greater than 15% is identified?
The scanning step is reduced to 50 mm; the section can be retested if necessary. Analysis is performed for each longitudinal profile separately, and the conclusion on pile integrity is made considering all profiles.
References
- Hampel F., Ronchetti E., Rousseeuw P., Stahel W. Robust Statistics: The Approach Based on Influence Functions. — Moscow: Mir, 1989.
- GOST R 71039-2023. Bored piles and diaphragm walls of trench and pile type. Crosshole ultrasonic method for concrete quality control.
Author: Denis Vorobev, Chief Laboratory Manager, LLC MATTEST. Expert content prepared for the website of the partner company LLC M-Instrument (MATTEST INSTRUMENT).